Hint Newsletter #7 PMI Data
Economic calendar - PMI as an indicator of changes in economic activity
The Purchasing Managers Index (PMI) is considered by economists and investors to be an important indicator of the economic growth and the state of business environment. In today’s article, we will talk about why these indices are important and where their added value lies.
Although the purchasing managers’ indices are relatively underestimated or misunderstood by many investors and traders, it is a fairly important figure reflecting changes in economic conditions in a given country and in the given sectors of the economy. It is an up-to-date data based on actual changes in the economy, which is its biggest advantage over some other important macro data that are published with a long delay (e.g. GDP) or undergo significant revisions (e.g. NFP).
Nowadays, when economists and investors want to have the most up-to-date and accurate data possible when making predictions about economic developments, PMI data is very valuable and its influence on the market events is significant.
Today, investors and economists are watching PMI data with a global reach, in particular from two companies. ISM (Institute of Supply Management) provides its data once a month, at the beginning of the month. S&P Global (originally PMI from IHS Markit, which merged with S&P Global in February 2022) publishes data twice a month, with preliminary data coming out a week before the end of the month and the final data at the beginning of the month. The Chicago PMI is also watched sometimes and in Canada the Ivey PMI, which is published by the Ivey Business School, is of interest.
Accurate data without sentiment
The Purchasing Managers’ Indices are based on a survey of purchasing managers from approximately 400 companies. They are compiled using standardised methods and are based on questions that track real changes in each sector. This prevents the data from being influenced by sentiment.
The questionnaires include different variables for each sector. For each, the manager is asked whether there has been an increase, decrease or no change from the previous month. When the index has a value of more than 50, it means that the sector is growing; when the value is below 50, it means a decline. If all respondents answered that there was growth in their industry, the index would be 100. If all respondents answered that the conditions were the same, the index would be 50.
Sales managers have a good overview of all aspects in their industry such as employment, inventory availability or delivery dates. Thus, by monitoring the behaviour of purchasing managers, a good picture of what is happening in each sector of the economy can be obtained. When an industry is growing and conditions are good, firms are willing to spend more money to meet future demand. It can be said that a high PMI value can be a good indicator of future inflation.
Manufacturing and services
Two indices in particular are monitored within the PMI, the PMI in the manufacturing sector and the PMI in the services sector. The Manufacturing PMI is published on the first working day of the month and provides an overview of changing conditions in the goods-producing sector. Within this index, five variables carry the most weight, including new orders, which tend to change in advance of others, then production, employment, supplier delivery times, and inventories.
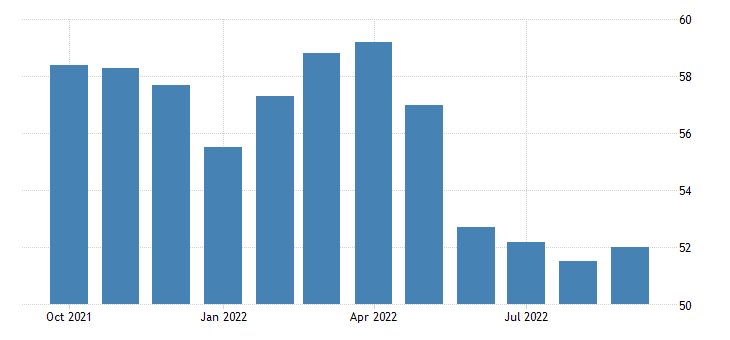
S&P Global US Manufacturing PMI

Source: Tradingeconomics.com
The Services PMI only began to be tracked in the 1990s as services began to account for an increasingly larger share of GDP than the manufacturing in advanced economies (ISM used to publish this index as the Non-Manufacturing PMI, but as of August 2020 it is officially called the Services PMI, and the data and methodology have not changed). The services sector PMI is published on the third working day of the month and tracks fewer variables because, for example, inventories are not as important in this sector. It includes financial services, consumer services and all other business services. This index mainly tracks business activity, new orders, employment or deliveries.
S&P Global US Services PMI

Source: Tradingeconomics.com
A complementary index is the Composite PMI, which is a weighted average of PMIs from the manufacturing and services sectors, with weights derived from official data on the share of each sector in GDP. The Construction PMI is also found in the economic calendar.
